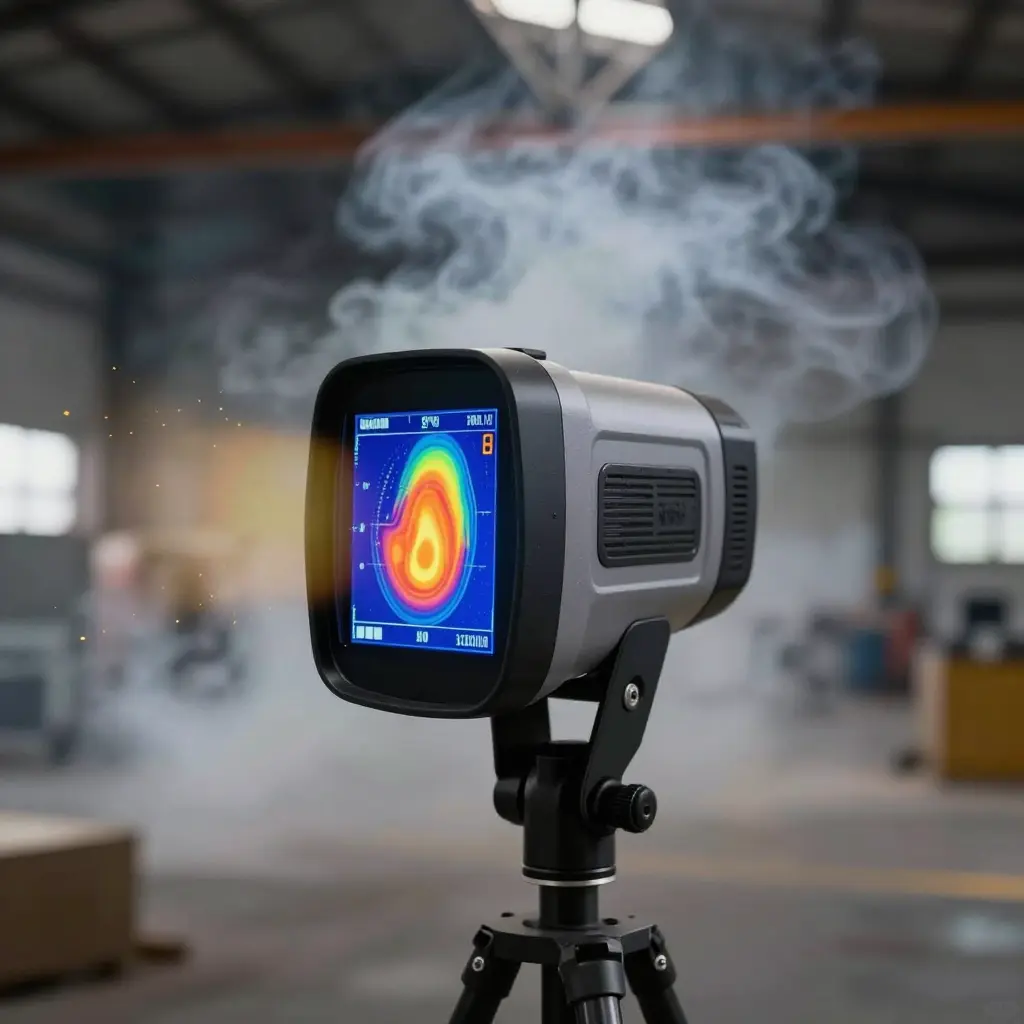
Most thermal imager purchases start with one number in the brochure: detection range, in metres, written as large as the marketing department could justify. That figure is measured in clear air, against a fixed temperature contrast, on a bench. Replace the bench with a smoke-filled warehouse and it stops describing anything a crew can use at a door.
Detection range is not a property of the camera alone. It comes out of two things working together: how well the sensor and lens resolve a small temperature difference, and how much infrared energy the air between camera and target lets through. Clean air is close to transparent in the thermal band. Smoke is not. Soot particles scatter and absorb that radiation, so a camera that finds a person at 800 m across an open yard may lose the same person at 60 m inside a charged compartment.
The question worth asking, then, is not what a camera’s detection range is, but how much smoke it still works through. The table sets the assumptions behind a datasheet figure beside what the same camera meets on a warehouse floor.
Caption: Published detection range assumes clear, dry air at stable humidity – none of which exists in a working smoke-filled warehouse.
| Datasheet assumption | Smoke-filled warehouse reality |
|---|---|
| 2 K target-to-background differential, ideal blackbody | 80 °C smoke layer between the lens and a 37 °C casualty |
| No atmospheric attenuation assumed over the test path | Extinction of 0.1 to 0.5 m⁻¹ in the 8-14 µm band, so 63 to 99% of the signal is gone within 10 m |
| Humidity below 50%, no airborne dust | 90% RH, with soot and dust suspended in the beam |
| Clean, freshly calibrated germanium window | A soot film that builds across a shift and cuts transmission |
| 1.8 m x 0.5 m upright target, 2 pixels on target, 50% probability | Crawling casualty, smaller critical dimension, oblique angle, 1 to 2 pixels |
| No limit on viewing time | Seconds to read the target before the layer obscures it |
Nothing in the right-hand column is unusual. Each line just takes away margin that the left-hand column assumed.
The Three Variables That Break Datasheet Numbers
A manufacturer measures in clean air, against a defined target at a defined distance. In a smoke-filled warehouse the signal is altered three times before the detector finishes a frame, and the alterations stack.
1. Smoke Density and Obscuration
Suspended particulate absorbs and scatters infrared energy, so less of the target’s own emission reaches the lens, and the loss grows with particle concentration and with path length. Those same particles radiate weakly at their own temperature, which lifts the background the camera is measuring. Contrast falls from both directions: the target dims, the background brightens, and every frame carries less for the display or the algorithm to work with.
2. Thermal Contrast Collapse
A detection algorithm compares target against background and triggers on a temperature difference. Put a cool smoke layer between a warm casualty and the lens and the radiance reaching the sensor is a blend of both, so the measured difference shrinks toward zero. Below the noise floor, no amount of pixel resolution recovers it. No datasheet can settle this one, because the missing signal never arrives at the detector.
3. Lens and Window Contamination
Soot, dust and condensed moisture build a film on the window, and the beam is attenuated before it enters the aperture. Transmission falls as the layer thickens, and a soot film only tens of micrometres deep already removes a measurable share of the incoming signal. Condensed moisture adds absorption plus a scattering haze of its own, and it appears exactly when a hot, humid fireground meets a cool germanium window. Soot settles by the mechanics covered in this explanation of why diesel soot settles across apparatus surfaces, where coatings build evenly and quietly.

Caption: The x-axis is measured obscuration in percent per metre, not distance to the fire.
Reading a Thermal Imager Datasheet Critically
Thermal imager datasheets lead with the strongest number, and the strongest number is almost always a clear-air detection range. The figures that decide whether the camera works in smoke sit in footnotes or are missing altogether: noise floor, pixel geometry, the distance criterion behind the headline, and the processing applied before an image reaches the screen.
NETD. NETD (noise equivalent temperature difference) is the smallest temperature difference the detector can resolve against its own noise. It is quoted in millikelvin and lower is better, but the number means little without its test conditions. A 30 mK reading taken on a 30 °C blackbody, with a fast lens, heavy temporal averaging and spatial noise reduction, is not the same behaviour as 30 mK at 60 °C ambient after ten minutes of heat soak in a closed bay. Ask for the blackbody temperature, the ambient temperature, the lens aperture, the frame averaging used, whether the figure is typical or best case, and whether noise reduction was running during the measurement.
IFOV versus detector resolution. IFOV is the angular size of one detector pixel in milliradians, set by detector pitch and focal length, and it decides how much of the target falls inside a pixel at a given distance. A 384 x 288 detector behind a long lens resolves smoke-obscured detail better than a 640 x 512 array behind a wide one, so array size on its own is not a ranking. Ask for IFOV in mrad at the quoted lens, the horizontal field of view, the detector pitch and the focal length, and whether the stated figure applies at the centre of the field or at the edge, where aberrations widen it.
Detection, recognition and identification distance. Published ranges follow the DRI convention, which descends from Johnson’s criteria and counts resolvable cycles – line pairs – across the target’s critical dimension: about 2 cycles for detection, 8 for recognition and 12.5 to 16 for identification, each at 50 percent probability. One cycle takes at least two detector pixels to resolve, so those thresholds land at roughly 4 to 6 pixels on target for detection, 16 to 24 for recognition and 25 to 48 for identification. The headline figure is nearly always the loosest of the three, around 2 pixels against a 1.8 m x 0.5 m human in clear air, and that is the number buyers compare across brands. Recognition range is roughly a quarter of it, and recognition is what a crew needs when the shape ahead could be a person or a stack of pallets.
| Criterion | Cycles and pixels on target (typical) | What it means on scene |
|---|---|---|
| Detection | 2 cycles, about 4 to 6 pixels | A hot patch is somewhere in the field of view |
| Recognition | 8 cycles, about 16 to 24 pixels | Object class is discernible, person versus vehicle or trolley |
| Identification | 12.5 to 16 cycles, about 25 to 48 pixels | Detail is resolvable, uniform, tool or body posture |
Ask which criterion the headline figure refers to, the target dimensions used, the pixels on target, the probability level and the attenuation assumed. Then ask the question the datasheet avoids: what range does this camera hold at 3 m visibility in smoke, and what transmission coefficient per metre does the quoted figure rest on?
Frame rate. Frame rate is quoted as 9 Hz or 30 Hz, and the choice is often an export-classification decision rather than an image-quality one. Ask for the native rate at full array resolution, whether the quoted rate is reached by windowing or cropping the detector, and whether frame stacking or smoothing is stabilising the image at the cost of motion response. A camera that looks calm in a showroom because it averages frames will lag when a crew sweeps a smoke-logged aisle.
Calibration and image-processing settings. Automatic gain control, digital detail enhancement, spatial noise reduction, non-uniformity correction intervals and ambient drift compensation all improve the apparent image, and all of them can distort the temperature relationships a crew reads off the display. Ask whether the published range and NETD figures were captured with enhancement switched off, whether manual gain and level override is available, how often a non-uniformity correction runs, and whether the calibration is traceable to a blackbody with a stated uncertainty. Then request a demonstration with the camera set to the configuration you will actually run in service.

Read it left to right: energy leaves the heat source, loses strength crossing the dashed attenuation band at the smoke layer, then passes the camera window into the detector array, processing unit and display. The small dashed branch below the window is the contamination path – a second, quieter thief of signal that datasheets rarely mention.
Verification checks before you commit
Bring this list to every demo; don’t sign until each line is ticked.
- Request the headline range quoted at a defined obscuration level, in writing.
- Ask whether that range came from real smoke testing or clean-air calculations, given how soot behaves in enclosed bays.
- Watch a demo through artificial smoke and time detection at the claimed distance.
- Check image stability at maximum scene temperature after fifteen minutes of running.
- Confirm the detection criterion – cycle count or pixel count – behind the figure.
- Verify lens cleaning access on site and time it with your own tools.
- Demand a written service interval and spare-parts list for detector, shutter and window.
- Secure a written guarantee tying payment to repeatable smoke-test results at your site.
FAQ: Thermal Imaging Camera Selection in Smoke
Does a higher-resolution detector alone solve smoke penetration?
No. What counts is pixel density on the target, not array size. Behind the same field of view, a 640 x 480 detector at 30 m puts roughly 2.2 cm on each pixel and a 320 x 240 unit puts 4.4 cm, and the smoke takes the same fraction of the signal in both cases. Transmission follows T = e^(-sL), so at an extinction coefficient of 0.5 per metre only 13% of 8-14 micron radiance survives 4 m of travel. No pixel count recreates contrast that never reached the lens.
How do I compare two datasheets that quote different detection range figures?
Convert both numbers to pixels on target. Ask each supplier for the target dimensions, the temperature difference and the criterion behind the figure: a 1.8 m by 0.5 m human at a 2 K delta-T against a 50% Johnson threshold is a usable standard, while a bare “up to 1,200 m” line is not. Divide the target’s critical dimension by the product of detection range and IFOV to get pixels on target, then buy the camera that still holds about 16 pixels across that dimension at your real sightline distance if you need recognition, and 4 to 6 if detection is all you need.
Should I halve the declared detection range for planning?
Halving suits light haze and fails in a smoke-filled warehouse. Work the transmission curve instead: 50% attenuation falls at ln 2 divided by the extinction coefficient, so 0.1 per metre gives about 6.9 m of usable sightline and 0.3 per metre gives about 2.3 m. Use the extinction coefficient for the band the camera sees, not the reading from a visible-light obscuration meter – the same smoke attenuates 8-14 micron radiation less than visible light, because sub-micron soot scatters weakly at those wavelengths, so a visible obscuration figure overstates the loss in the thermal image. Set detection range from a measured coefficient at the expected standoff, then verify it with a live burn at that exact distance.
What maintenance routine preserves detection performance?
Clean the germanium window at the start of every shift in a dusty warehouse and after every exposure to smoke, and clean it wet: wiping a dry window grinds grit into the coating, and a scratched window scatters more energy than the dust it removed. Each month, image a fixed reference target at 20 m and log the indicated delta-T; a 2 °C fall flags coating damage or microbolometer drift long before the annual calibration date. Replace any window with scratches across more than about 1% of its aperture, since that loss is permanent and invisible on the display.
Turn the analysis into a rule your tender document can enforce
Write the camera specification against a smoke-obscuration condition, not a headline distance. The tender should state the obscuration level the unit must resolve an image through, the target size and surface temperature at which it is measured, the ambient conditions in the space, and the cleaning regime assumed during the test. Lens contamination belongs inside the operating condition rather than in a footnote, so pair the obscuration figure with an inspection interval based on how diesel soot settles on optical surfaces. The camera also needs a named job attached to it – search, size-up or overhaul – because justifying equipment spend by task is what keeps a defensible number in the budget line instead of a flattering one.
The goal is an envelope, not a record figure
What thermal imaging camera selection should produce is a defensible operating envelope: the smoke density, standoff distance and maintenance state within which you can honestly say the device will show a person-shaped heat signature. Evaluate vendor claims the way you would evaluate any declaration, and ask about comparing declared versus delivered performance before the figures reach the specification. A smaller, honest range you can defend to a regulator or an insurer is worth more than the largest number on a page. CIMC Fire Rescue supplies intelligent firefighting equipment and integrated station solutions, and we build camera specifications into the same envelope-based planning we apply to apparatus bays, extraction and washdown.